


GIS for Health
ABOUT THE PROJECT
Sponsor:
THRC's Community Health and Economic Resilience Research (CHERR) Center of Excellence
PI:
Dr. Shadi Maleki
Research Pillar(s):


GIS for Health maximizes research participation and impact for specific populations by incorporating local patterns and geographic context. It is a crucial tool for analyzing and visualizing place-based data, helping to understand social determinants of health and improve community resilience.
GIS can be used to examine health outcomes and identify patterns and disparities that are influenced by factors such as income, education, and access to healthcare. By mapping resources like clinics and grocery stores, GIS reveals areas lacking essential services, such as healthy food and healthcare.
This ability to visualize gaps enables policymakers to design targeted interventions for at-risk populations, leading to more effective resource allocation and tailored health programs.
Researchers & Collaborators

Dr. Shadi Maleki
Researcher, THRC
GIS Services for Research
GIS MAP PRODUCTS
View maps that focus on topics impacting health+resilience in Texas communities.
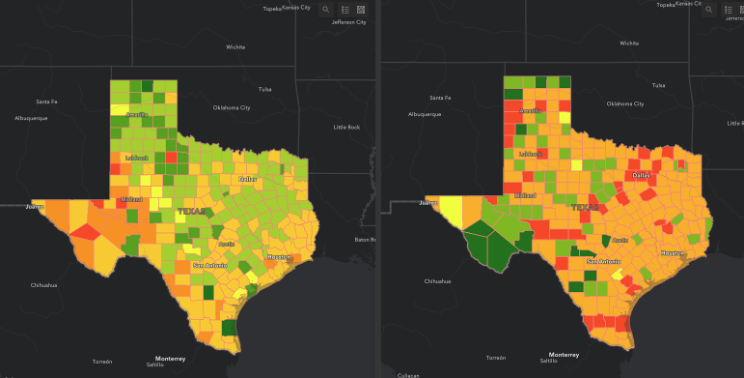
The 2019 Texas Community Resilience Dashboard shows the different levels of vulnerability to disasters and similar events such as pandemics at the county level in Texas. It also shows risk factor predominancy for each county and the relative level of vulnerability compared to the national estimates.
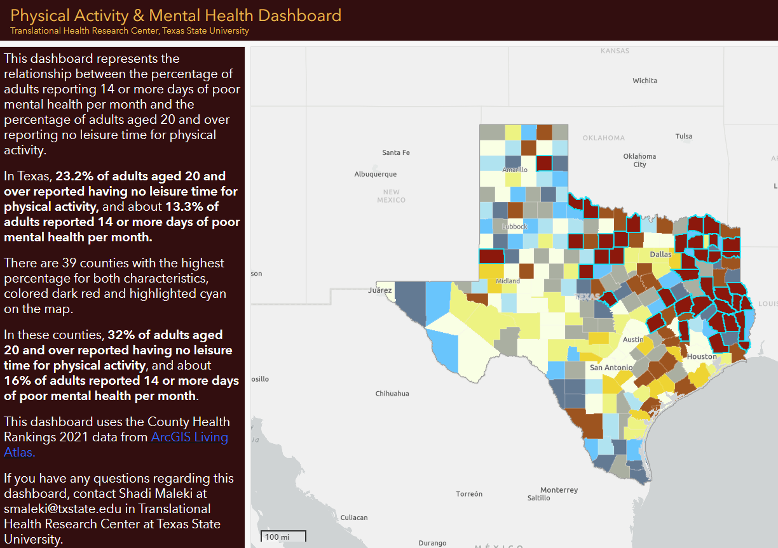
The Physical Activity & Mental Health Dashboard dashboard represents the relationship between the percentage of adults reporting 14 or more days of poor mental health per month and the percentage of adults aged 20 and over reporting no leisure time for physical activity.
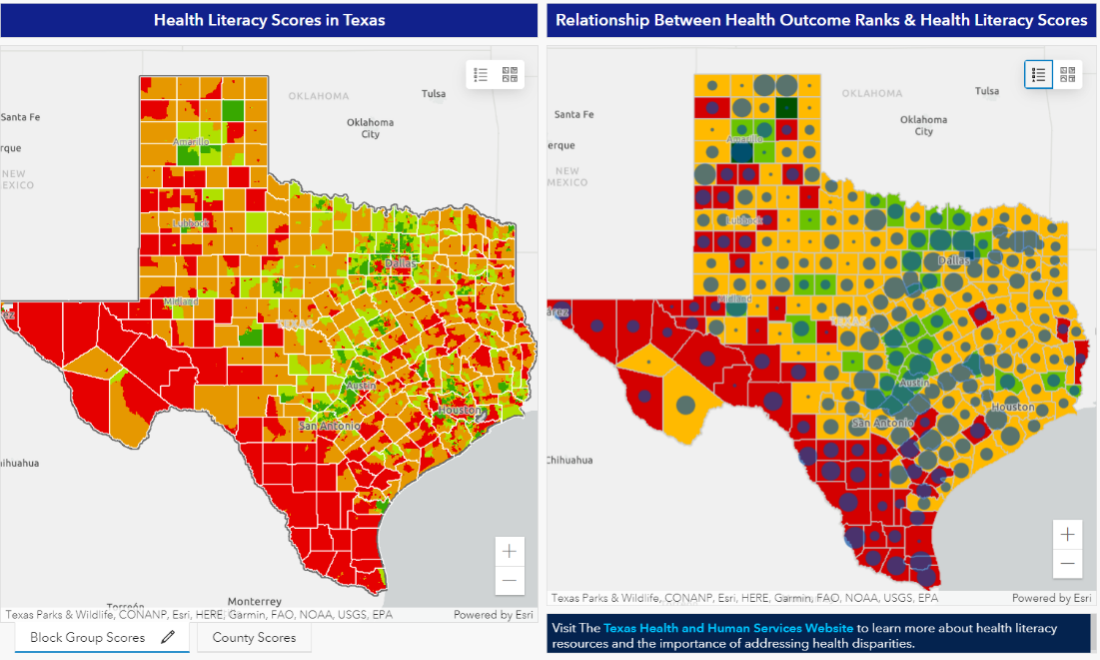
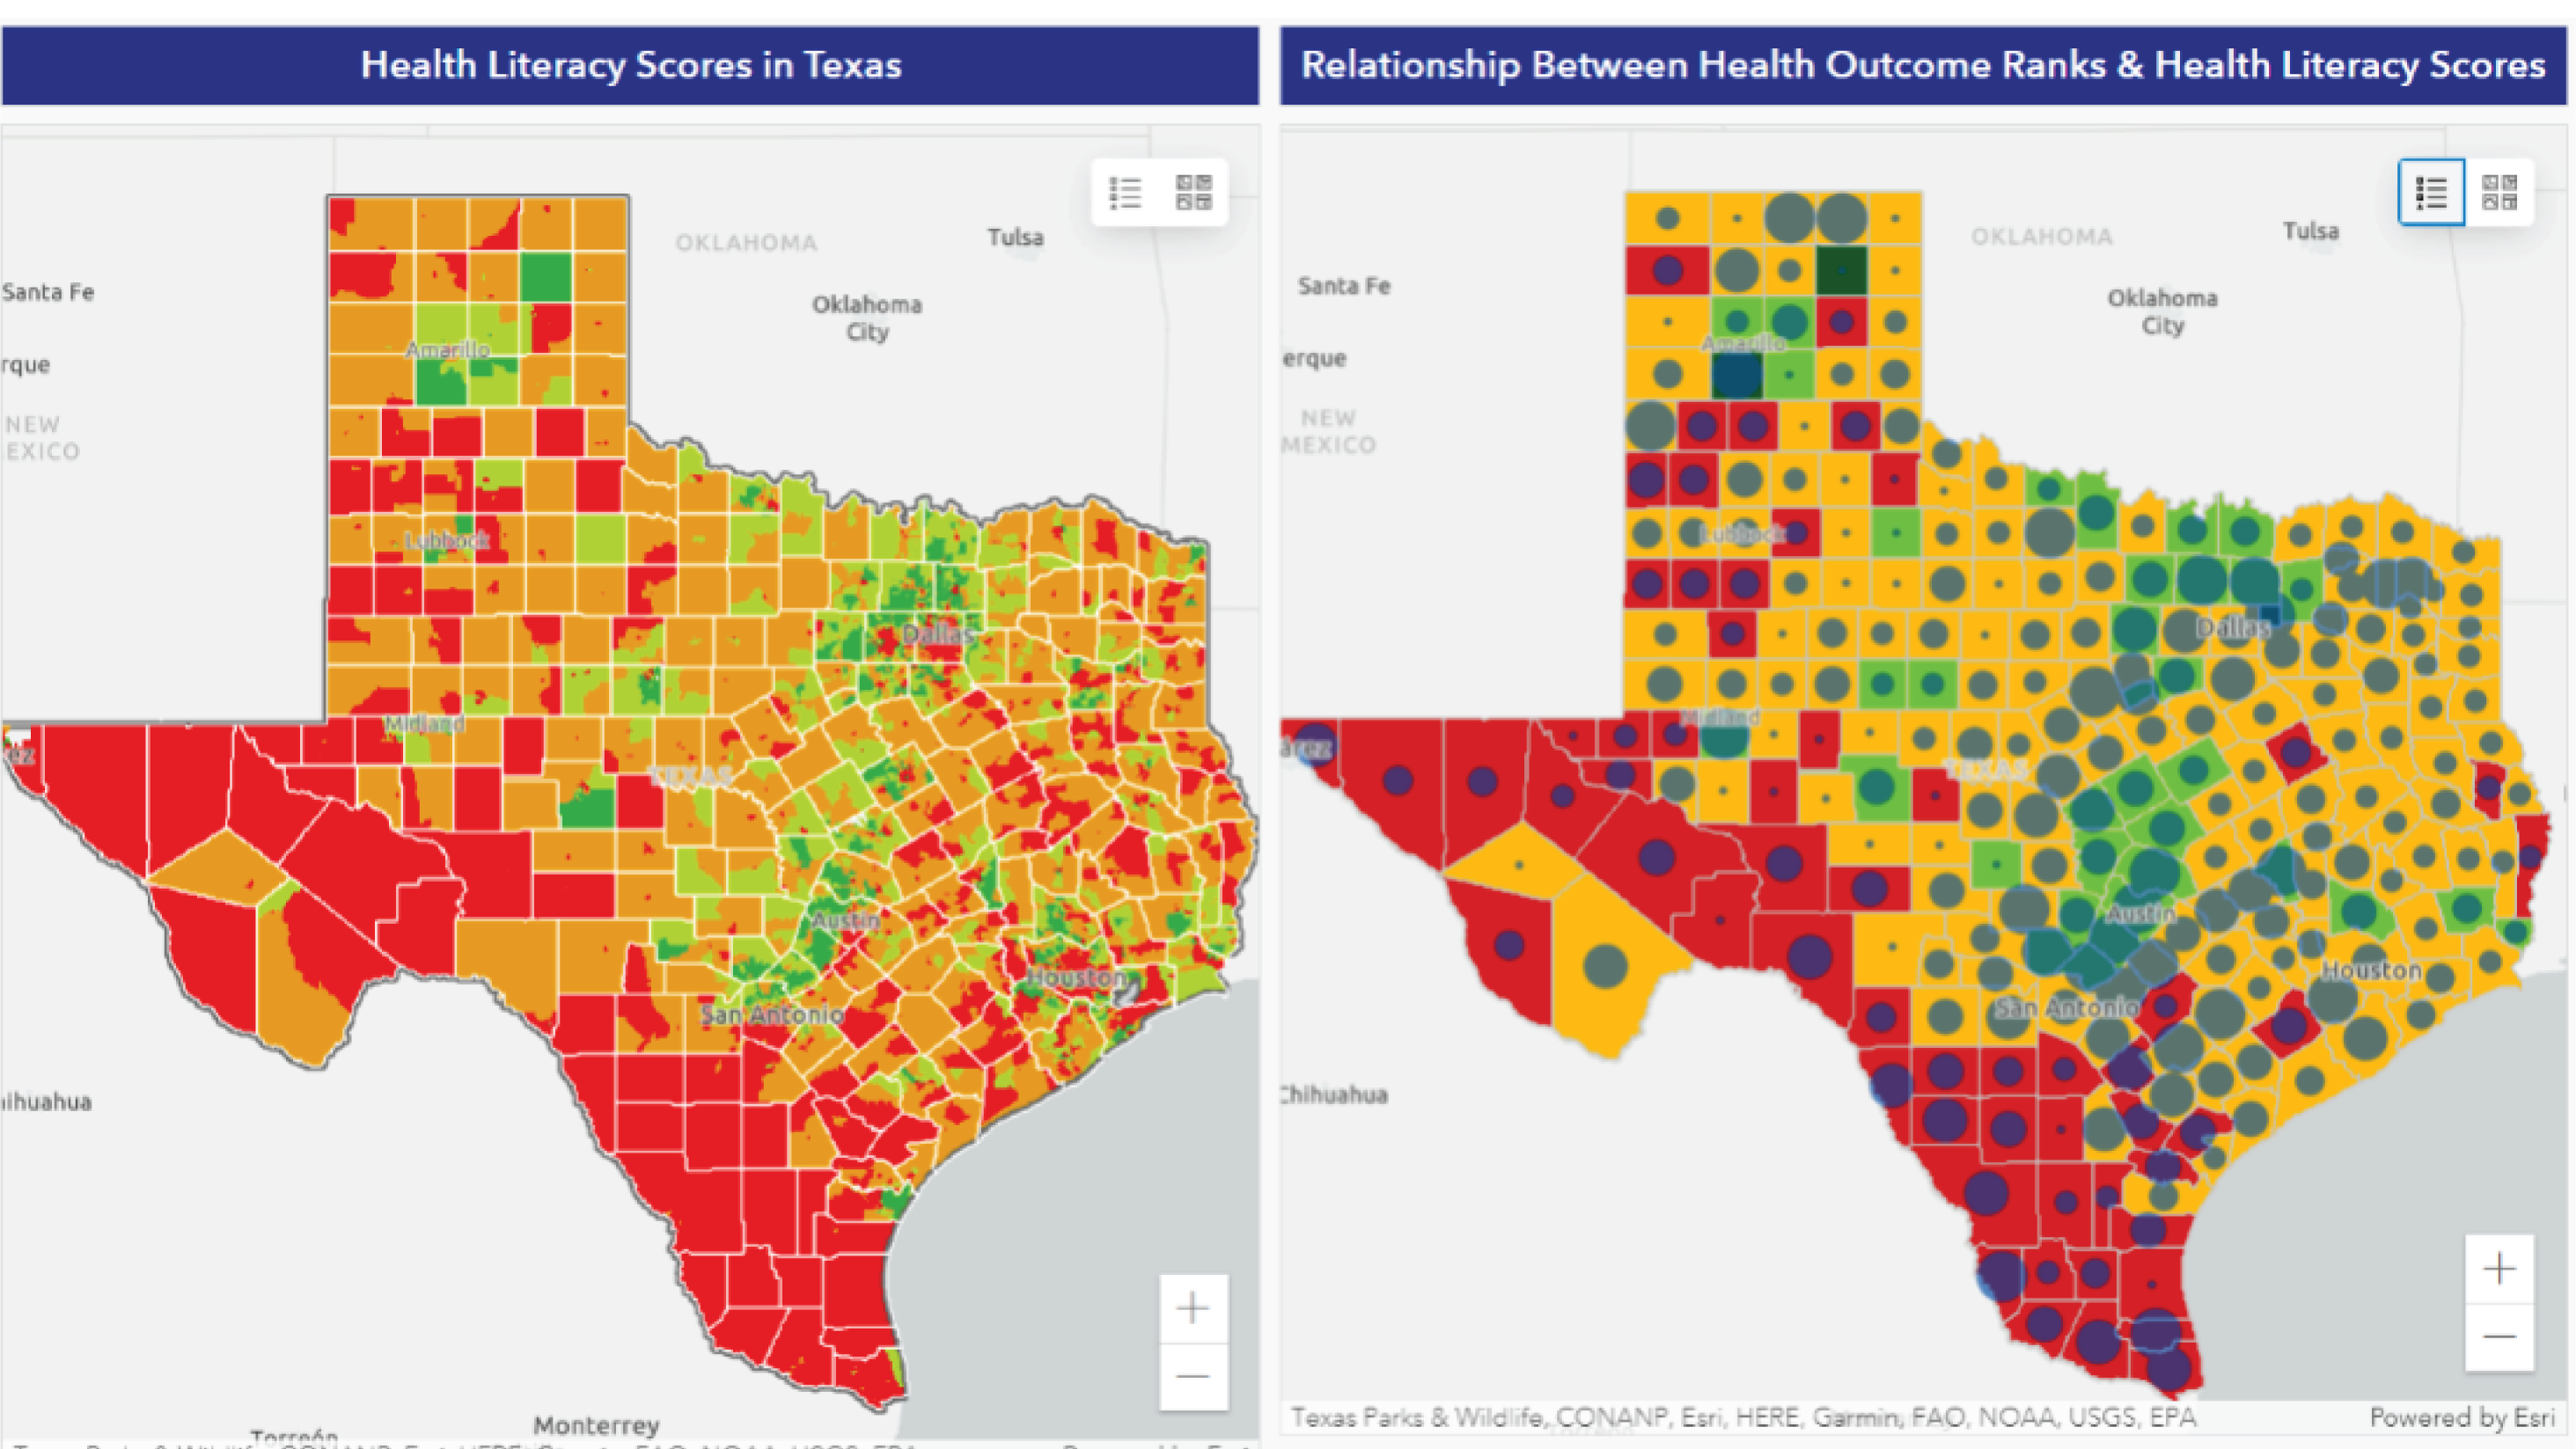
The Health Literacy Scores in Texas dashboard shows health literacy scores in Texas at the block group and county levels. It also includes a map that shows the relationship between health literacy scores and health outcome rankings.
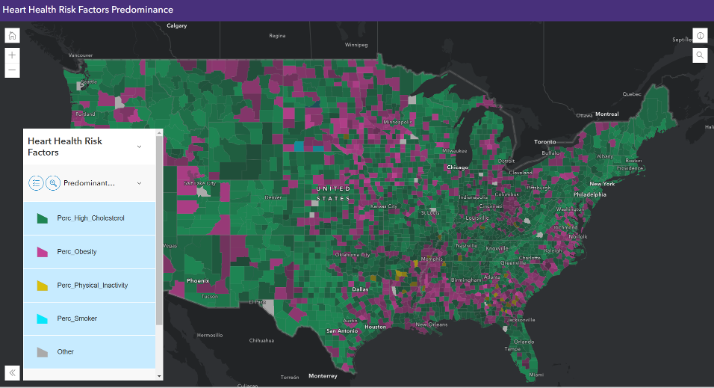
This web application shows the predominant risk factor for heart health in each county. The risk factors included in this map are high cholesterol, being overweight, physical inactivity, and smoking.
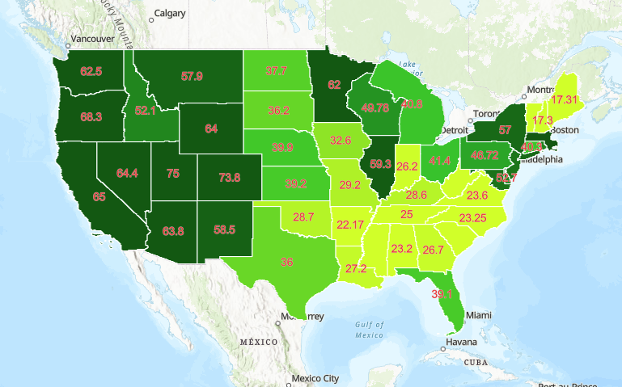
This map shows the percentage of people who live near a park. By clicking on each state, a table showing the prevalence of high blood pressure and coronary heart disease will open. It is possible to see an association between living close to a park and the prevalence of high blood pressure and coronary heart disease.
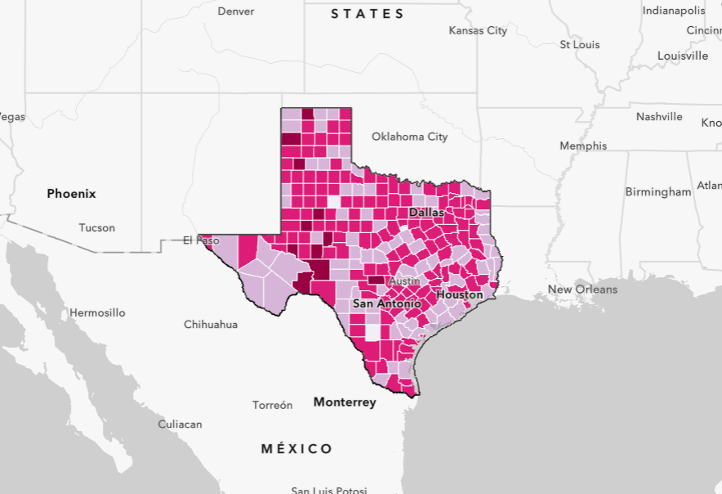
This dashboard shows the percent change in food insecurity and price per meal between 2019 and 2020 in Texas counties.
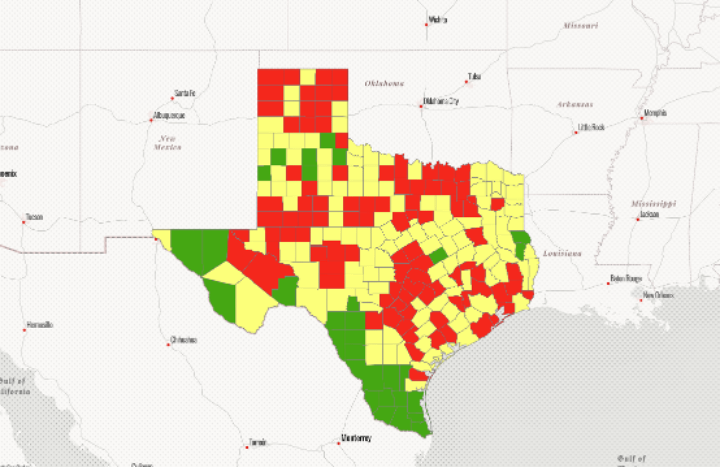
This map shows the percent change in excessive drinking between 2019 and 2022 in Texas counties.
STORY MAP
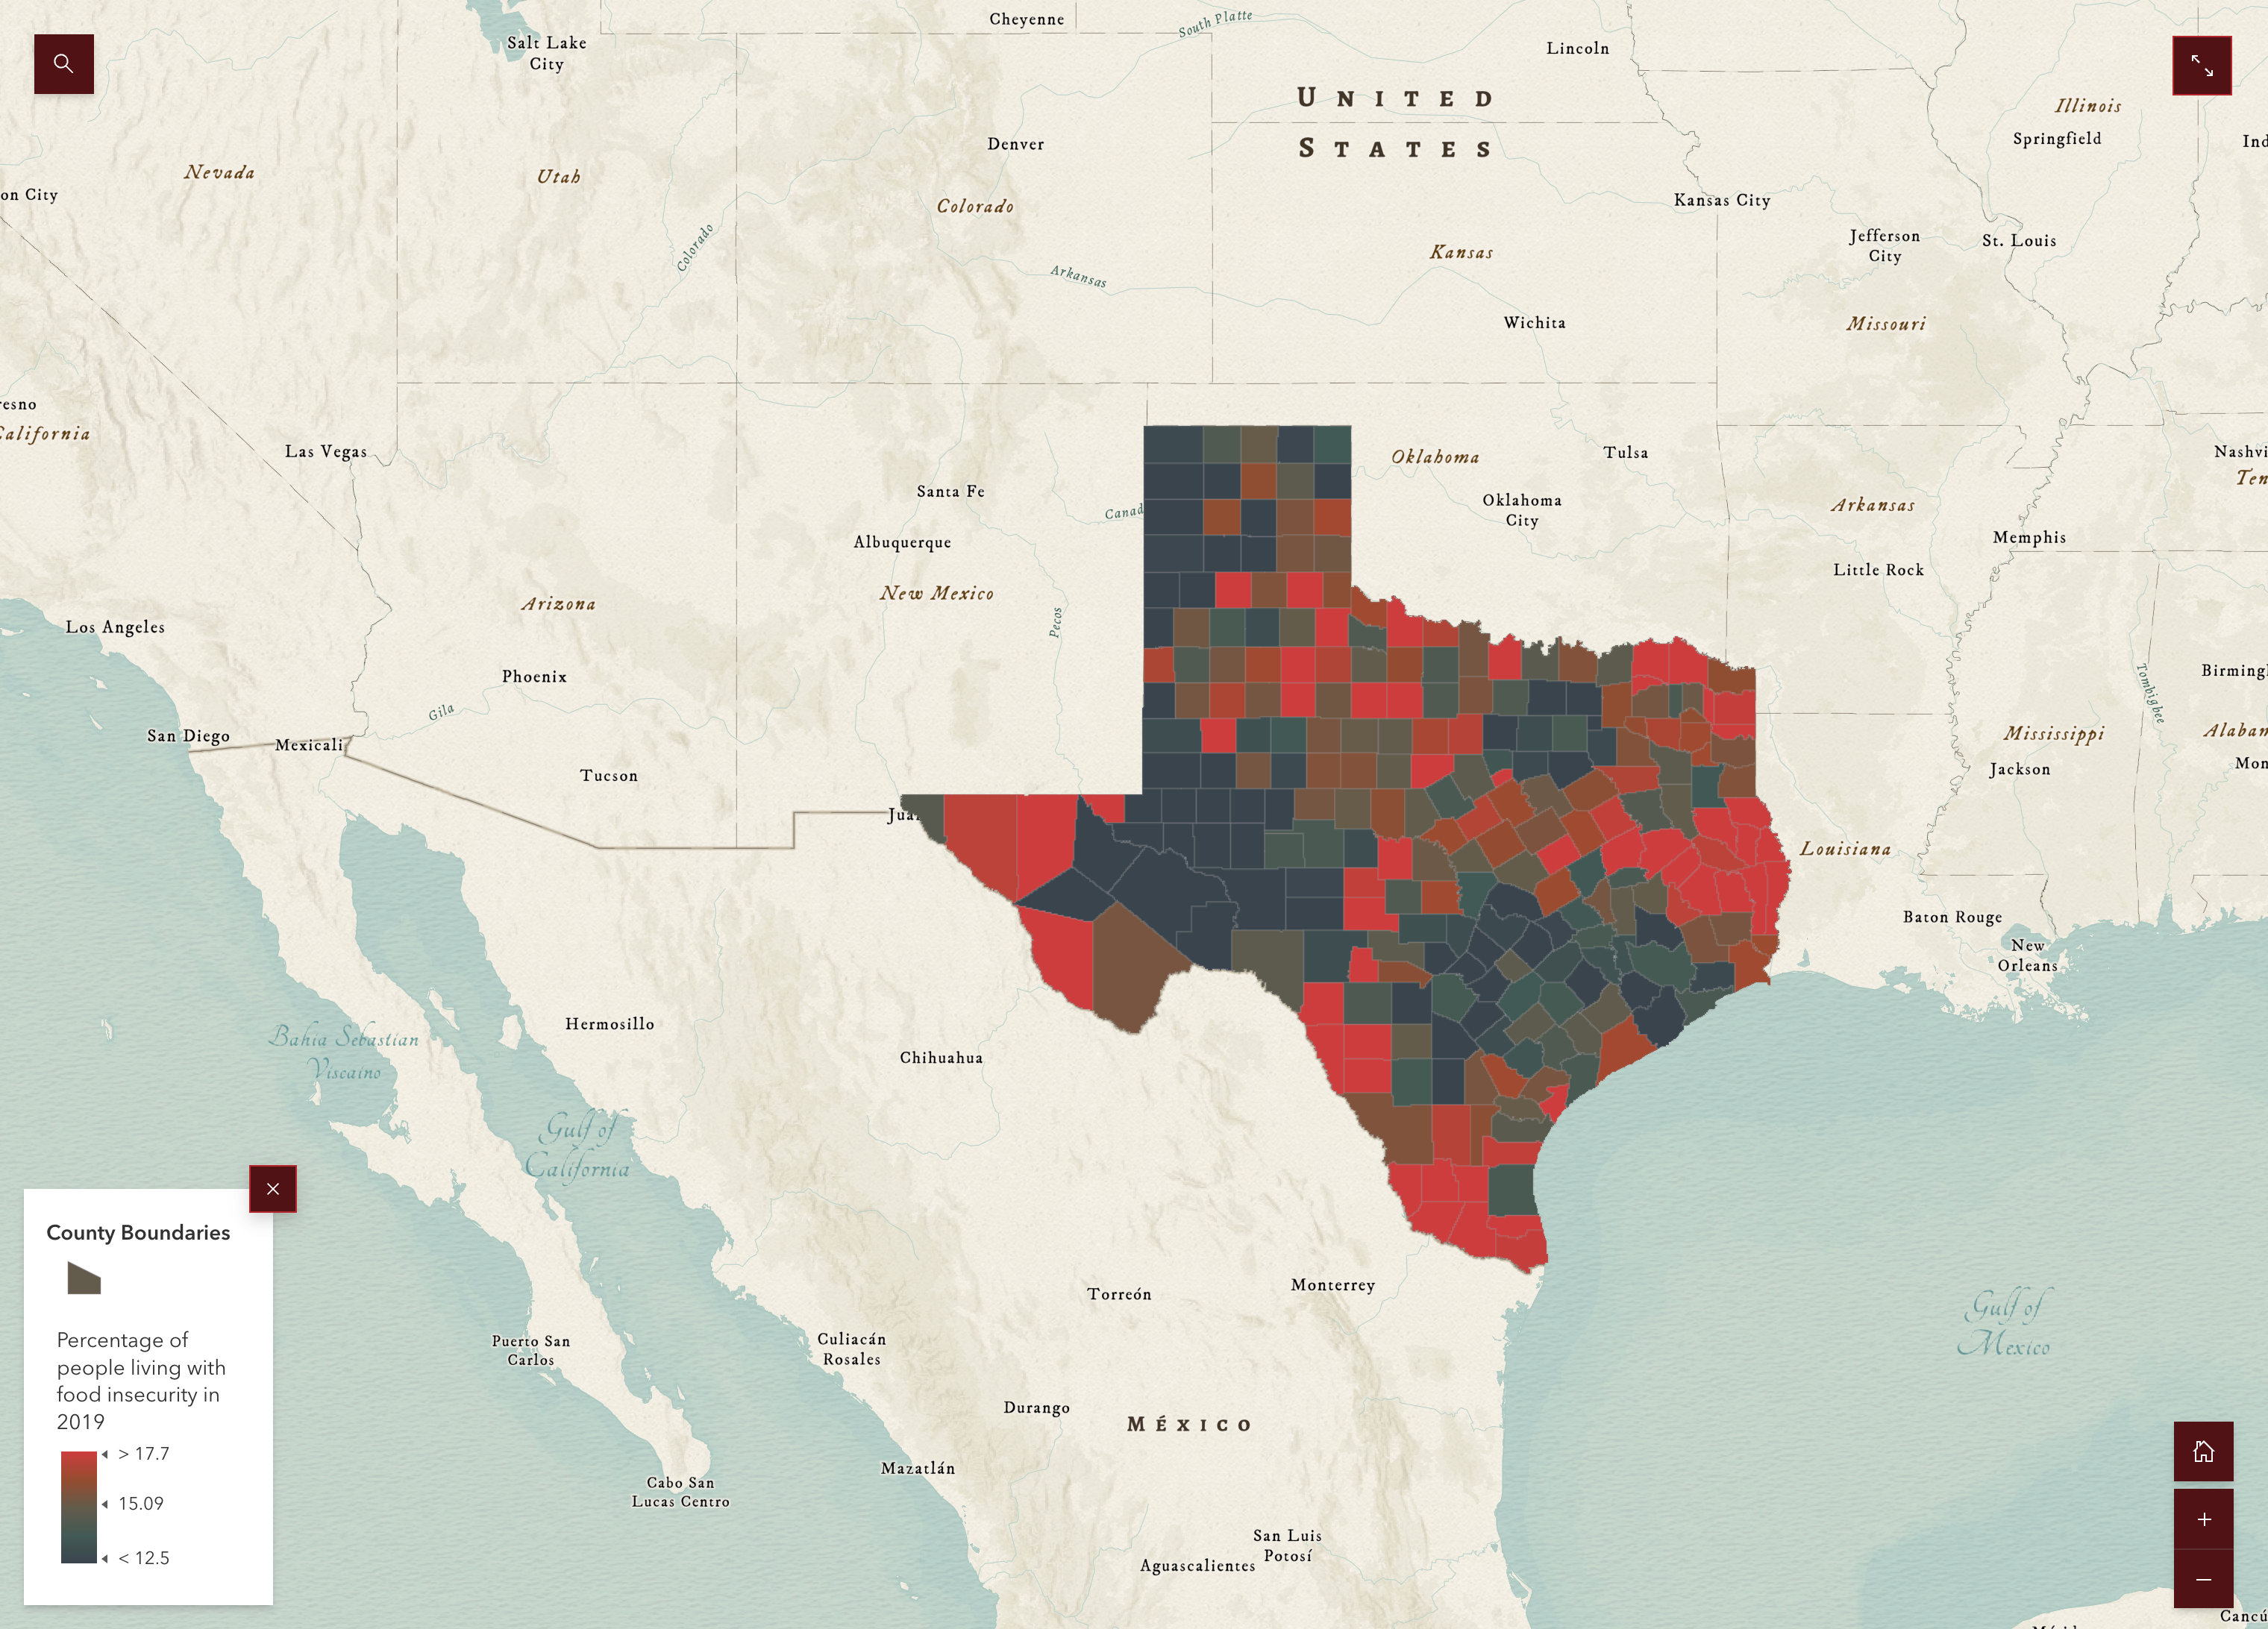
Food Insecurity and Consumption in Texas Story Map
This story map discusses food insecurity, access, and consumption in Texas counties.
Desktop version of the story map >>
For more information about food insecurity in the elderly population specifically, visit the NUEVA website.
PUBLICATIONS
Mapping Access to Children’s Hospitals in Texas
Authors: Shadi Maleki, Nathaniel Dede-Bamfo, Elizabeth Ekren, Milad Mohammadalizadehkorde, and Melinda Villagran
Neighborhood Child Friendliness: A Comparative Analysis of Parental Landscape Perceptions and Geographic Information Systems-Based Urban Planning Indexes
Authors: Shadi Maleki, Ronald R. Hagelman III, and Brendan L. Lavy
African American Experiences in the Historic Dunbar Neighborhood in San Marcos, Texas: A Case Study of Counter-Life Stories
Authors: Shetay Ashford-Hanserd, Eric Sarmiento, Colleen C. Myles, Steven W. Rayburn, Aimee Kendall Roundtree, Mary-Patricia Hayton, Edward Ybarra, Sarai Benitez, Theresa M. Clifford, Christopher Pierce, Chad D. Williams, and Shadi Maleki
A Visual Insight Into Tweeting Activity Before and During Natural Disasters: Case Study of Hurricane Harvey
Authors: Shadi Maleki and Milad Mohammadalizadehkorde
Investigating Children's Field Trip Experiences Through Sketch Maps
Authors: Shadi Maleki, Emily Warren, Ronald R. Hagelman III, Aspen Navarro, and Miranda Wait
Social Demand for Urban Wilderness in Purgatory
Authors: Shadi Maleki, Jason P. Julian, Russel C. Weaver, Christina Lopez, and Mike Kraft